
Task 4c
Investigating cue-rate variability of deep-divers due to geographic region, behavioral state and group size and composition
Previous research on deep-diving cetacean species has shown that geographic differences in acoustic behavior must be considered when using acoustic cues for abundance estimation in a new region (Douglas et al. 2005, Warren et al. 2017). This task will focus on sperm whales and will utilize archived data from combined visual and acoustic surveys to assess cue rate variability in an LMR priority region. The data available include recordings from towed passive acoustic arrays, with concurrent visual sightings during daytime hours.
Team members
- Yvonne Barkley
- Erin Oleson
- Karlina Merkens
Species considered
- Sperm whale (Physeter macrocephalus)
Data available
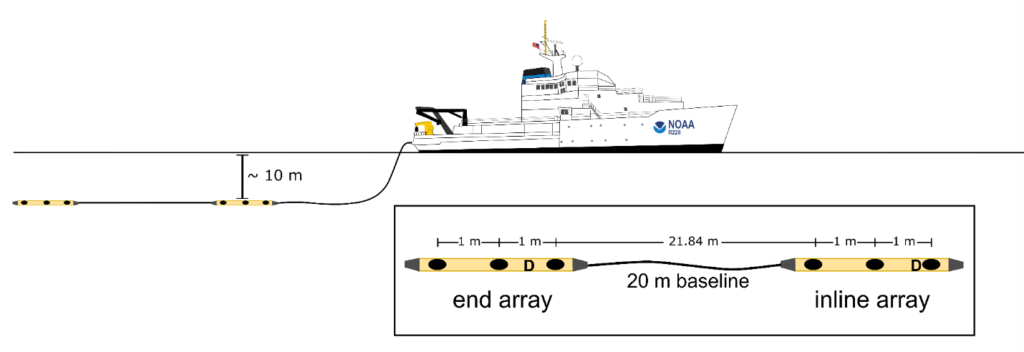
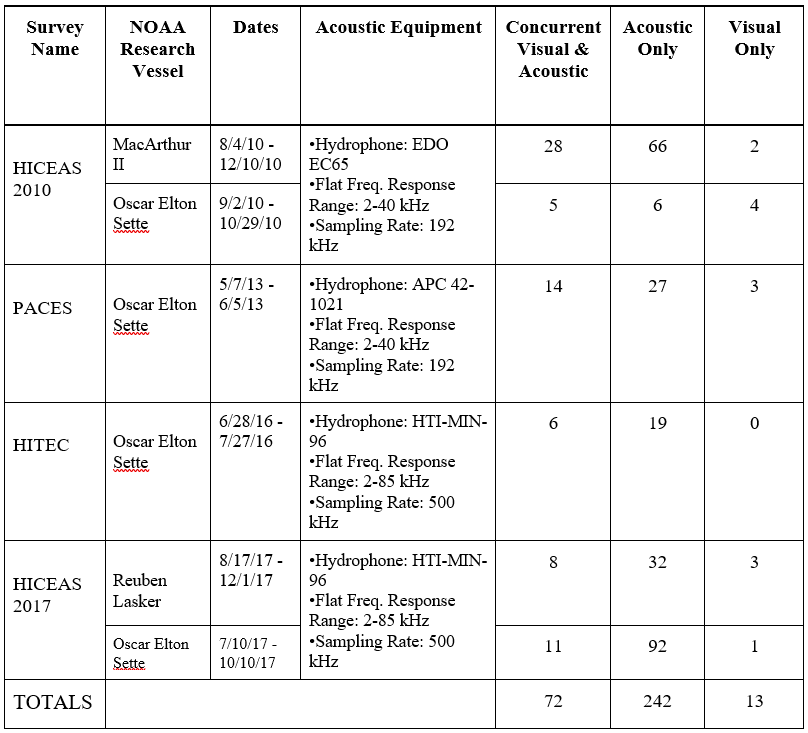
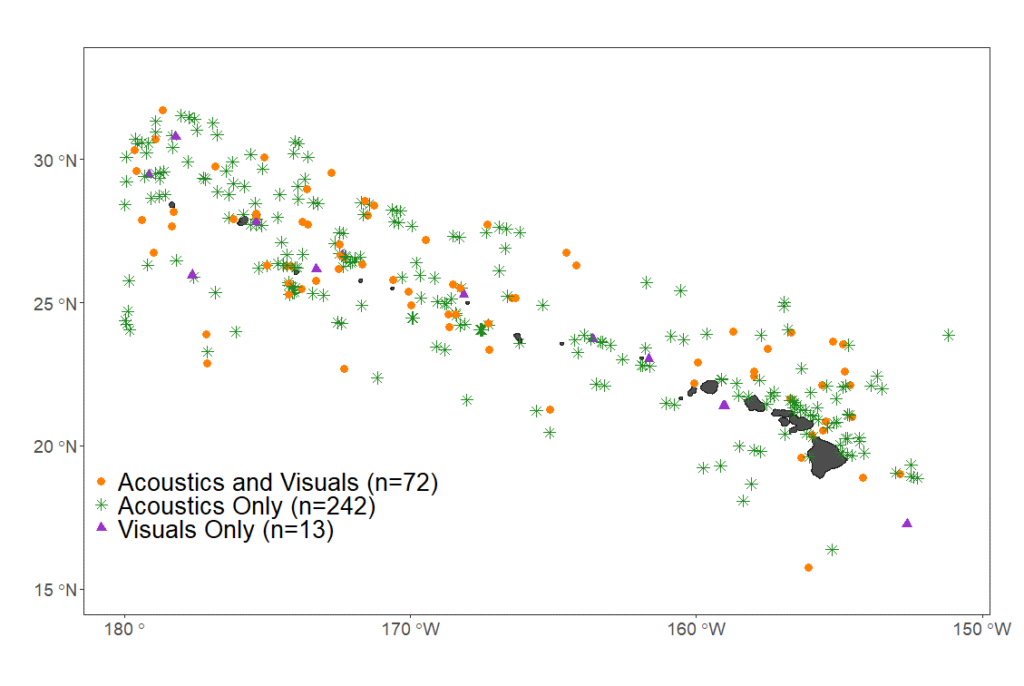
Passive acoustic towed array data were collected as part of 5 years of visual/acoustic surveys in the Main Hawaiian Islands in the Central North Pacific Ocean. Continuous acoustic recordings were collected using custom-built hydrophone arrays (Figure 1) towed at approximately 4-10 m deep, 300 m behind the ship while traveling at 18.5 km/h (10 kt). The components of the towed hydrophone arrays and data acquisition systems varied between surveys (Table 1). During daylight hours, trained acousticians monitored the recordings in real-time with headphones and visually inspected the sounds using spectrograms in either ISHMAEL or PAMGuard software. When cetacean sounds were detected, a localization algorithm was used to calculate a bearing (direction) to the sound source relative to the hydrophones. Bearings to the animals were plotted on a map, and over the course of an acoustic encounter, the bearings would converge to a single location. A perpendicular distance to the animals was estimated to the convergence of bearings with left/right ambiguity. In some cases, the ambiguity in perpendicular distances was resolved if the ship turned while the animals were still vocalizing. Acoustic encounters were associated with sightings when acoustic bearings were consistent with the observed location of the animal group. A total of 327 acoustic encounters of sperm whales were detected, 72 of which were also seen and 242 were only detected by the acoustics team. Only 13 sperm whale encounters were seen but never heard (Table 1, Figure 2). Since cue rates could not be directly observed, the term ‘click detection rates’ was used to acknowledge that we could not precisely assess the proportion of time the whales were silent from the towed array data.
Approach taken
The overarching goal of this subtask was to estimate the click detection rates of sperm whales in the North Pacific Ocean using a combined visual and acoustic detection data set. To apply these click detection rates to acoustic density estimation, there are factors that could affect click production and detectability, which were explored in this analysis. These factors included the type of click produced by the whales, the number of whales in a group, and the distance of whale groups from the towed array. Sperm whale echolocation clicks are typically identified based on their low frequency (2-15 kHz), long duration (100 µs – 1s), and high amplitude (180-230 dB), characteristics. Sperm whales produce four main click types that have been associated with different behaviors by decades of research (Figure 3). Interestingly, 68% of sperm whale groups that were seen by visual observers included groups that produced codas (38 out of 56 groups) (Fig. 4). The visually observed groups that did not contain codas included fewer animals and primarily included regular and slow clicks (Fig. 5). The distance at which groups were detected from the array did not appear to have a significant effect on the click detection rates (Fig. 6). Subsequent analysis involved a deeper examination of how these factors influenced click detection rates. For further details, see Final Summary below.
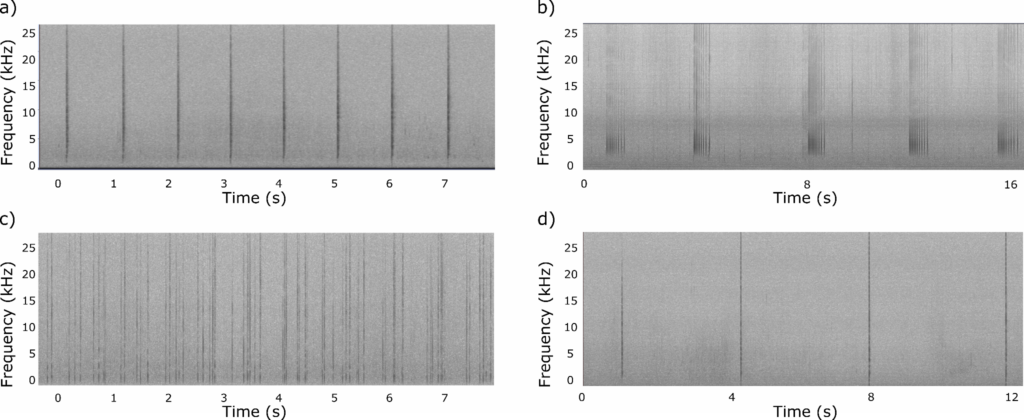

Figure 4. Most acoustically detected sperm whales that were also seen by visual observers formed larger groups producing codas, a click type indicating social interactions between individuals.

Figure 5. Sperm whale groups seen by visual observers but not producing codas included fewer animals overall.

Figure 6. Click detection rates of sperm whale groups did not appear to be affected by the distance detected from the array.
Progress – October 2024
Our findings were published in the Journal of the Acoustical Society of America on April 17, 2024! Below is a summary of the main results, but more details can be found at the link below.
Barkley, Y. M., Merkens, K. P. B., Wood, M., Oleson, E. M., & Marques, T. A. (2024). Click detection rate variability of central North Pacific sperm whales from passive acoustic towed arrays. The Journal of the Acoustical Society of America, 155(4), 2627–2635. https://doi.org/10.1121/10.0025540
Abstract: Passive acoustic monitoring (PAM) is an optimal method for detecting and monitoring cetaceans as they frequently produce sound while underwater. Cue counting, counting acoustic cues of deep-diving cetaceans instead of animals, is an alternative method for density estimation, but requires an average cue production rate to convert cue density to animal density. Limited information about click rates exists for sperm whales in the central North Pacific Ocean. In the absence of acoustic tag data, we used towed hydrophone array data to calculate the first sperm whale click rates from this region and examined their variability based on click type, location, distance of whales from the array, and group size estimated by visual observers. Our findings show click type to be the most important variable, with groups that include codas yielding the highest click rates. We also found a positive relationship between group size and click detection rates that may be useful for acoustic predictions of group size in future studies. Echolocation clicks detected using PAM methods are often the only indicator of deep-diving cetacean presence. Understanding the factors affecting their click rates provides important information for acoustic density estimation.
Final summary
All of the acoustic encounters in the data set with sperm whales were analyzed for click detection rates. Before calculating click detection rates, each acoustic encounter was categorized depending on the types of clicks present as a way to incorporate the behavioral context of each group. The four “click-type groups” included encounters with whales producing: (1) codas, (2) only regular clicks, (3) only slow clicks, and (4) a combination of regular and slow clicks.
Since the true silent periods of sperm whales could not be assessed from the towed array data, we split each acoustic encounter into “click trains” to represent only the periods when clicks were detected to use as the unit for calculating the overall click detection rate. Click detection rates were calculated per encounter by dividing the total number of clicks by the total duration of click trains (i.e., silent periods omitted). For comparison purposes, click detection rates were also computed by dividing the total number of clicks by the total time between the first and last click of the encounter (i.e., silent periods included). Encounter-level click detection rates from both methods were averaged to obtain a mean click detection rate for each click-type group. Generalized additive models (GAMs) were implemented to evaluate the potential nonlinear effects of different factors on click detection rates calculated using the click trains and the total encounter duration. These factors included the perpendicular distance to the animals, click-type group, encounter latitude and longitude, Julian day, and survey year.
The variability in sperm whale click detection rates was evaluated using 49 towed array sperm whale encounters collected during three shipboard line-transect cetacean abundance surveys within the Hawaiian Archipelago, 20 of which were seen by visual observers (Figure 1). Overall, sperm whale encounters lasted an average of 66.9 minutes (1.1–225.4 minutes) and produced an overall mean click detection rate per encounter of 1.39 clicks/s from the click train data set and 0.74 clicks/s when using the total encounter duration. Click detection rates varied by click-type group, ranging from an average of 0.30 clicks/s for slow clicks to 2.87 clicks/s for codas (Table 1).
We compared click detection rates calculated from both the click trains and the total encounter duration data sets to gain a better understanding of the overall clicking behavior of the sperm whales. As expected based on their definition, mean click detection rates were higher for the click trains as they included less silent time than the total encounter duration (Fig. 2, Table 1). Even though the click train data set produced higher standard deviations in the click detection rates, the spread around the median click detection rates was similar within click-type groups. The GAMs revealed click-type group to be the most important factor affecting click detection rates (Fig. 3).
This study contributed new information about sperm whale click detection rates in the central North Pacific Ocean, showing that the behavioral state of sperm whales affected their click detection rates in this region. Results provided information about the variability in click detection rates that may be useful when applying cue-based density methods to autonomous acoustic platforms. Ideally, future studies would deploy acoustic tags on sperm whales from this region to validate the amount of time whales are silent, as well as the amount of time they typically spend in different behavioral states. From this it could be determined to what degree the amount of time spent in each behavior state affects the overall average cue production rate of the population, and consequently would improve cue-based density estimates. In the meantime, the available towed array data offered new insights into sperm whale acoustic behavior and provided a basis for future click rate studies of this endangered species in the central North Pacific Ocean.
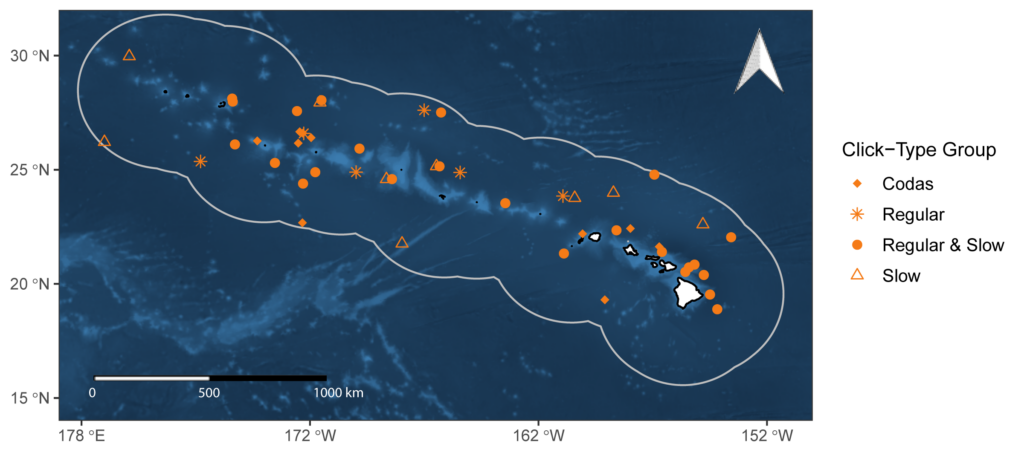
Figure 1 Study area with locations of sperm whale encounters included in the click detection rate analysis. The bathymetry of the study area is indicated using a blue color scale ranging from 0 – 6619 m, with lighter and darker shades depicting shallower and deeper depths, respectively.
Table I. Summary results of sperm whale acoustic encounters from towed array data organized by click-type group. Mean encounter duration was calculated using the time difference between the first and last detected click. The inter-click interval (ICI) threshold percentile was used to obtain the ICI threshold as a cutoff value for determining the start of a new click train. The mean click detection rates (CDR) with standard deviations computed from the individual click trains, all click trains, and the total encounter duration are provided.


Figure 2 Box plots of all sperm whale encounters show the minimum, first quartile, median, third quartile, and maximum values of the overall click detection rates calculated using only click trains (black) and the total encounter duration (gray) for each click-type group. The total number of acoustic encounters within each click-type group is represented by n.
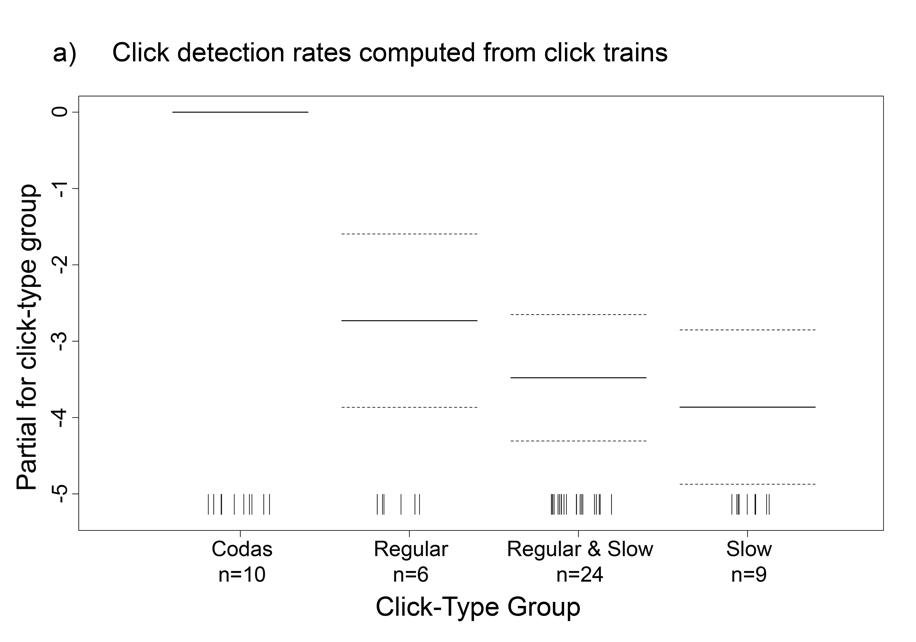
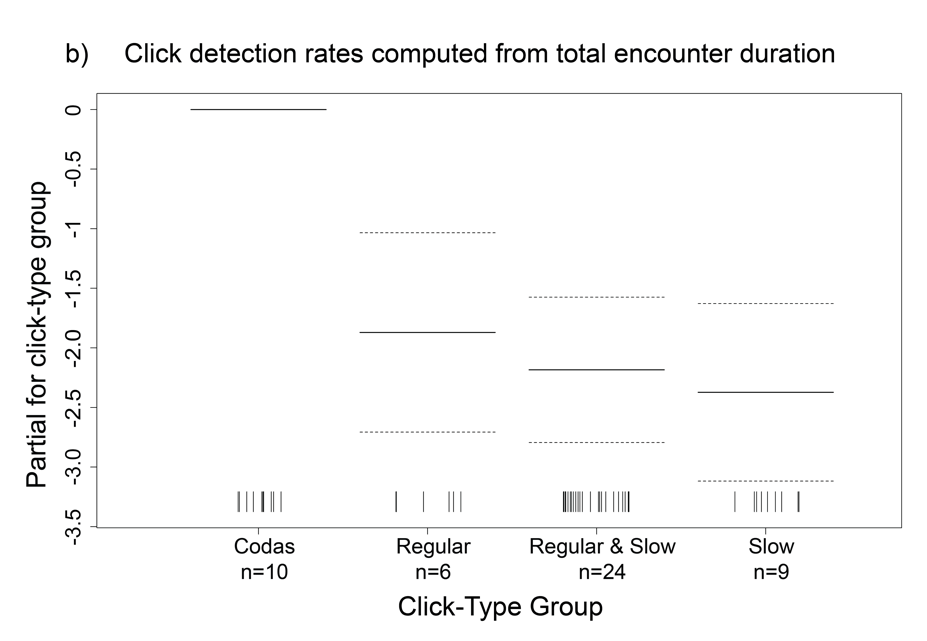
Figure 3 Two generalized additive models including all acoustic encounters resulted in click-type group as the only significant predictor of sperm whale click detection rates calculated from a) click trains and (b) the total encounter duration. Models included 49 towed array sperm whale encounters.
Last words
This task is now complete and no additional outcomes are expected from it. We continue to work on the data exploring them to gain further ecological insights about sperm whales around the Hawaiian Islands.
Figure 4. Rockin’ example of a one-of-a-kind Aloha shirt (model: Tiago A. Marques), complete with surfers shralping the gnar down the side of a spectacular sperm whale.